Definition
A carbon footprint measures the total carbon dioxide (CO2e) emissions generated by specific processes or products and can encompass emissions by individuals, households, collectives, institutions, or countries. The approach of analyzing carbon footprints against income examines how carbon emissions correlate with income levels, be they individual, household, or national.
In addition to CO2e, total greenhouse gas emissions are often quantified in terms of equivalent CO2e needed to cause a given amount of global warming. A household or entity’s carbon footprint is often based on emissions associated with its consumption (see Consumption-Based Accounting). Alternatively, carbon footprints can be based on emissions associated with income or wealth. For the wealthiest ~1% of the population in most countries, emissions related to wealth or investments form a significant proportion of carbon footprints.
The motivation for the study and understanding of how carbon footprints relate to income emerges from well-established links between inequality and negative impacts on both sustainability and human well-being (see Carbon Inequality, Climate Justice). Practical considerations, such as pinpointing responsibility for carbon emissions and therefore targeting ways to reduce them are also important motivators.
History
The footprint term itself emerged in the academic literature as a subset of the “ecological footprint” concept, coined by William E. Rees in 1992. Originally, in this usage, carbon footprint represented the land area needed to sequester the produced by human activity (minus that absorbed by the oceans) for the whole world or a nation’s population. Rather than equivalent land area, “carbon footprint” is now typically measured directly in terms of mass of emissions.
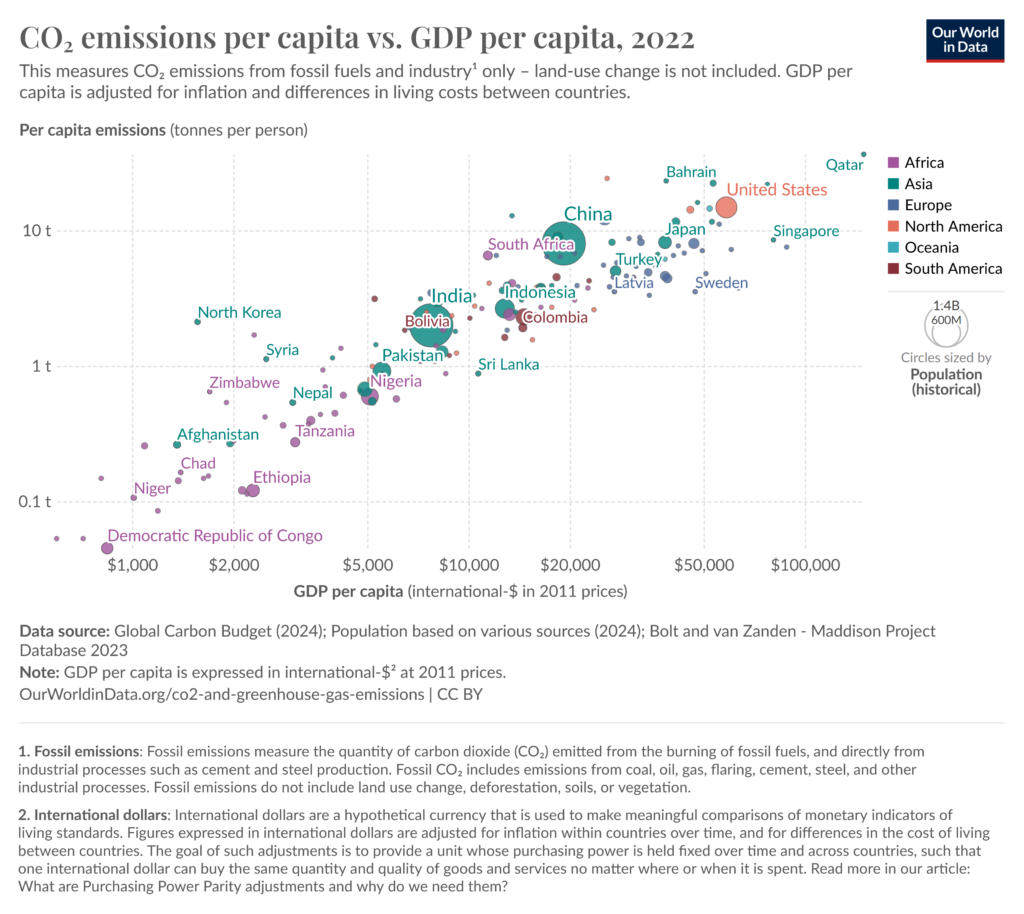
Income inequality’s relationship to emissions became an important part of discussion and research in the 1990s, with an initial focus primarily on per capita footprint versus per capita Gross Domestic Product (GDP). GDP per capita remains a common proxy for average national income, although it is worth noting that it does not include income from offshore holdings, like measures such as Gross National Income (GNI). Higher per capita income is strongly correlated with an increased per capita carbon footprint (see Figure 2.1 for illustration).
In the 2000s, the study of carbon emissions gradually shifted from large global or national scales to individual corporations, products, households, and individuals. This came from a need to understand the sources of carbon emissions in depth, to develop detailed policies and specific actions to decrease them (see Co-Benefits of Climate Policy). These footprints are calculated using environmentally extended input-output tables and household survey data on consumption and incomes. Much popularization of the term at an individual or household level was made, particularly in the form of easy-to-use household carbon footprint calculators. These revealed to the public the high carbon emissions associated with things like driving, airline travel, and meat consumption (see Sustainable Mobility, Protein Shift).
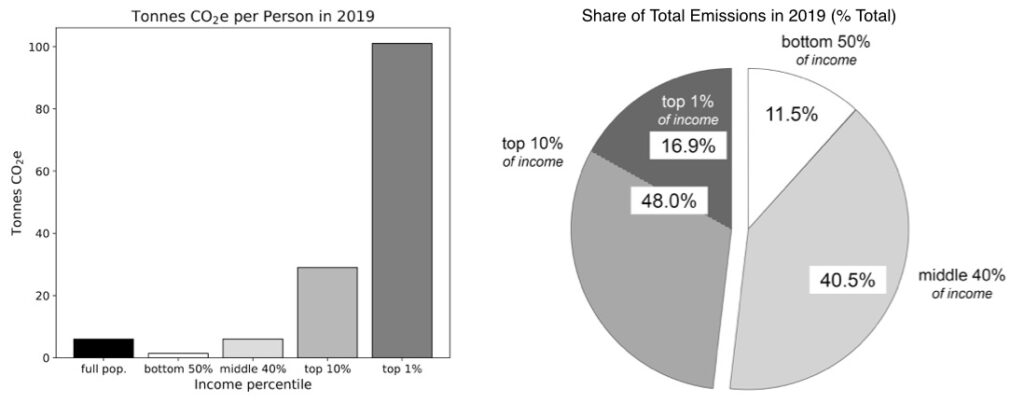
Additionally, thanks to improved income and wealth data within countries, and more recently on a global level, a growing body of work focuses on how carbon footprints relate to household or individual income. The highest-income (per year) or wealthiest (in terms of net worth) individuals have the largest and increasing carbon footprints and a disproportionate share of the global carbon footprint. To make this concrete, the top 10% of the global income distribution is responsible for about 50% of all global emissions (see Figure 2.2). Not only this, but carbon footprint inequality within countries surpassed between-country inequality around 2010. High carbon footprints in high-income households can be attributed to the large emissions associated with investment and consumption factors like (i) larger detached or multiple homes (see Sustainable Housing, Urban Planning and Spatial Allocation) and (ii) high levels of luxury and service consumption (see Conspicuous/Positional Consumption), highly individualized and energy-intensive transportation (e.g., private vehicles, private jet travel, motorized yachts), and frequent global travel. The huge emissions coming from this group’s investment and lifestyle choices are wholly incompatible with keeping global warming impacts below 1.5 degrees (see 1.5-Degree Lifestyles).
Different Perspectives
An issue with a focus on carbon footprints versus individual or household income is that individuals are often limited in the realistic choices available to them (see Freedom of Choice, Choice Editing). For example, an individual cannot choose to take public transit to work if there is no transit available to take them there in a timely fashion. Additionally, although individual measures of carbon footprint include the corresponding portion of production, because of concentrated private ownership of production, at least in capitalist countries, an individual or household generally does not have agency over the production process itself.
An abundance of household and individual carbon footprint calculators is now available, which include socioeconomic factors. While useful, this focus tends to suggest households can and will choose to make small tweaks in their consumption patterns rather than requiring changes to collective consumption or re-examination of the metabolism of the economic system (see Consumer Scapegoatism, Stocks Versus Flows, Steady-State Economy). Such an individual focus tends to yield very minimal changes in carbon footprint at a country level. Additionally, it has been widely reported that carbon footprint – in an individual/household consumption framing – was originally popularized in the early 2000s by media campaigns of large fossil fuel companies, particularly the oil giant British Petroleum, to delay systemic action to transition away from fossil fuels.
Increasing work on attributing carbon footprint to different income brackets has provided a partial antidote to the limitations of individual carbon footprints by putting such work into a larger context. Excess unsustainable final consumption, and therefore additional fossil fuel consumption, is partly driven by the distribution of incomes in an economy (see Money).
For the very wealthiest individuals, in the top 0.1% or so globally, most income comes passively from investments. Work remains to be done to collect sufficiently complete data globally to accurately understand the impact of income generated from investment assets and capital gains on carbon footprint.
Differences in carbon footprint definition, accounting, and modeling can also significantly impact estimated emissions. Accounting for the embodied carbon footprint in globally traded goods and services is important, as are choices in which processes are considered as part of a given product or service. Land use changes for shifts in production are often ignored (e.g., a shift from grassland or forest to industrial farming), which can lead to underestimates of actual carbon footprint changes from increased or changing consumption. The choice of time horizon for warming potential equivalent can complicate the comparison of studies since different greenhouse gases have different warming impacts over time. Characterizing these and other choices in methodology in different contexts remains a highly active area of research.
Applications
Some research indicates that previous consumption-based approaches like carbon taxes can be regressive, impacting low- and medium-income households hardest. Tax rebates can offset this impact (see, e.g., Canada’s carbon tax system). However, public support remains poor, especially in car-dependent areas and the highest-income households may have enough savings to protect them from environmentally necessary lifestyle changes.
Instead, a strong but progressive income as well as wealth tax could be more effective, ideally implemented both nationally and globally, as suggested by Thomas Piketty and others. This would serve the additional policy objective of reducing the harms of growing income inequality, such as growing political polarization. If simply redistributed, this would likely result in a net increase in overall consumption and therefore in carbon footprint, since lower-income households spend a higher proportion of their income than high-income households (see Personal Carbon Allowance). Instead, re-investment into solutions that reduce average consumption while increasing the quality of life for low- to middle-income people will be essential, such as high-quality shared rather than private services where possible (e.g., public transit, sharing systems) and de-carbonized energy production (see Foundational Economy, Universal Basic Services, Product-Service Systems, Sharing Economy). This broad policy combination is consistent with that advocated by proponents of Degrowth, who argue for overall consumption reduction, particularly in high-income countries, by replacing highly individualistic ways of living and consuming with more efficient collective modes of service provision and shared resources.
Further Reading
Chancel, L. (2022). Global carbon inequality over 1990–2019. Nature Sustainability, 5, 931–938. https://doi.org/10.1038/s41893-022-00955-z.
Household carbon footprint calculator. (2024). US EPA. Available at: https://www.epa.gov/ghgemissions/household-carbon-footprint-calculator (accessed: 3 June 2024).
Liobikienė, G. (2020). The revised approaches to income inequality impact on production-based and consumption-based carbon dioxide emissions: Literature review. Environmental Science and Pollution Research, 27(9), 8980–8990. https://doi.org/10.1007/s11356-020-08005-x.
Scrucca, F., Barberio, G., Fantin, V., Porta, P.L., & Barbanera, M. (2021). Carbon footprint: Concept, methodology and calculation. In Carbon footprint case studies: Municipal solid waste management, sustainable road transport and carbon sequestration. https://doi.org/10.1007/978-981-15-9577-6_1.
Starr, J., Nicolson, C., Ash, M., Markowitz, E.M., & Moran, D. (2023). Income-based US household carbon footprints (1990–2019) offer new insights on emissions inequality and climate finance. PLoS Climate, 2(8), e0000190. https://doi.org/10.1371/journal.pclm.0000190.